
Amid numerous global disruptions, the global shipping container market size grew from $10.24 billion in 2022 to $11.18 billion in 2023. Despite this growth, thousands of businesses have suffered financial and time losses while trying to find the best time and locations to buy, sell, and lease containers.
In this blog, we will give you an overview of container prices and SOC leasing rate trends for 2022-23. And how you can access this data yourself to make better trading and leasing decisions in this volatile container market.
Overview of container prices in 2022
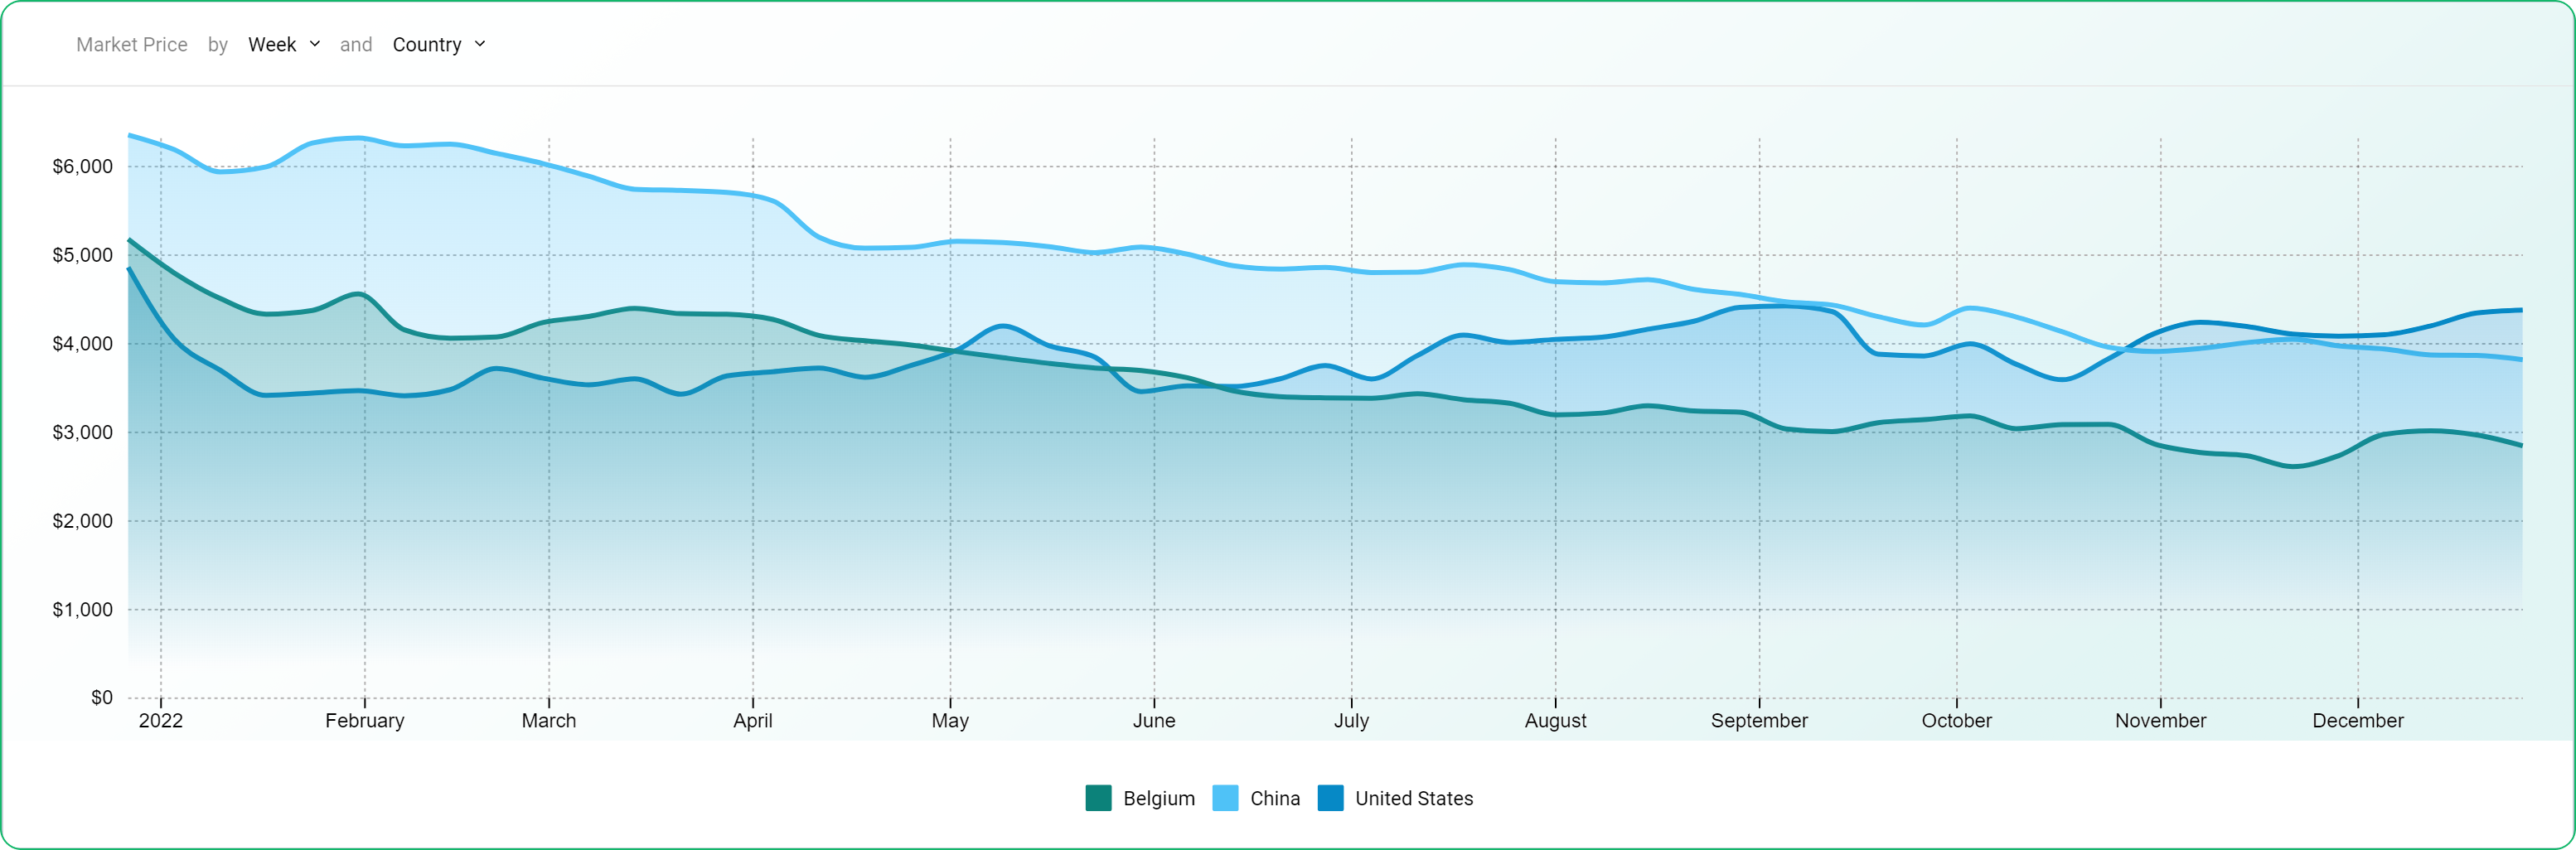
With the ease of Covid restrictions in many countries, we’ve seen a gradual drop in container prices towards the middle of 2022 and even more so at the end. This shows that container prices are steadily reverting to their pre-Covid level.
However, the US is an exception to this rule. Despite the ease of lockdown and Covid restrictions, container prices steadily hiked in the US owing to inflation.
For example, the price of 40HCs (brand new) has dropped by 36% and 38% in Belgium and China, respectively. Whereas, in the US, the price of these same containers increased by a paltry but impactful 3%. Take a look at the graph below to see how this subtle increase remains prevalent for the US despite the mild dips in the time series.
Overview of SOC leasing rates in 2022
SOC leasing rates throughout 2022 have proven to be even more volatile than container prices.
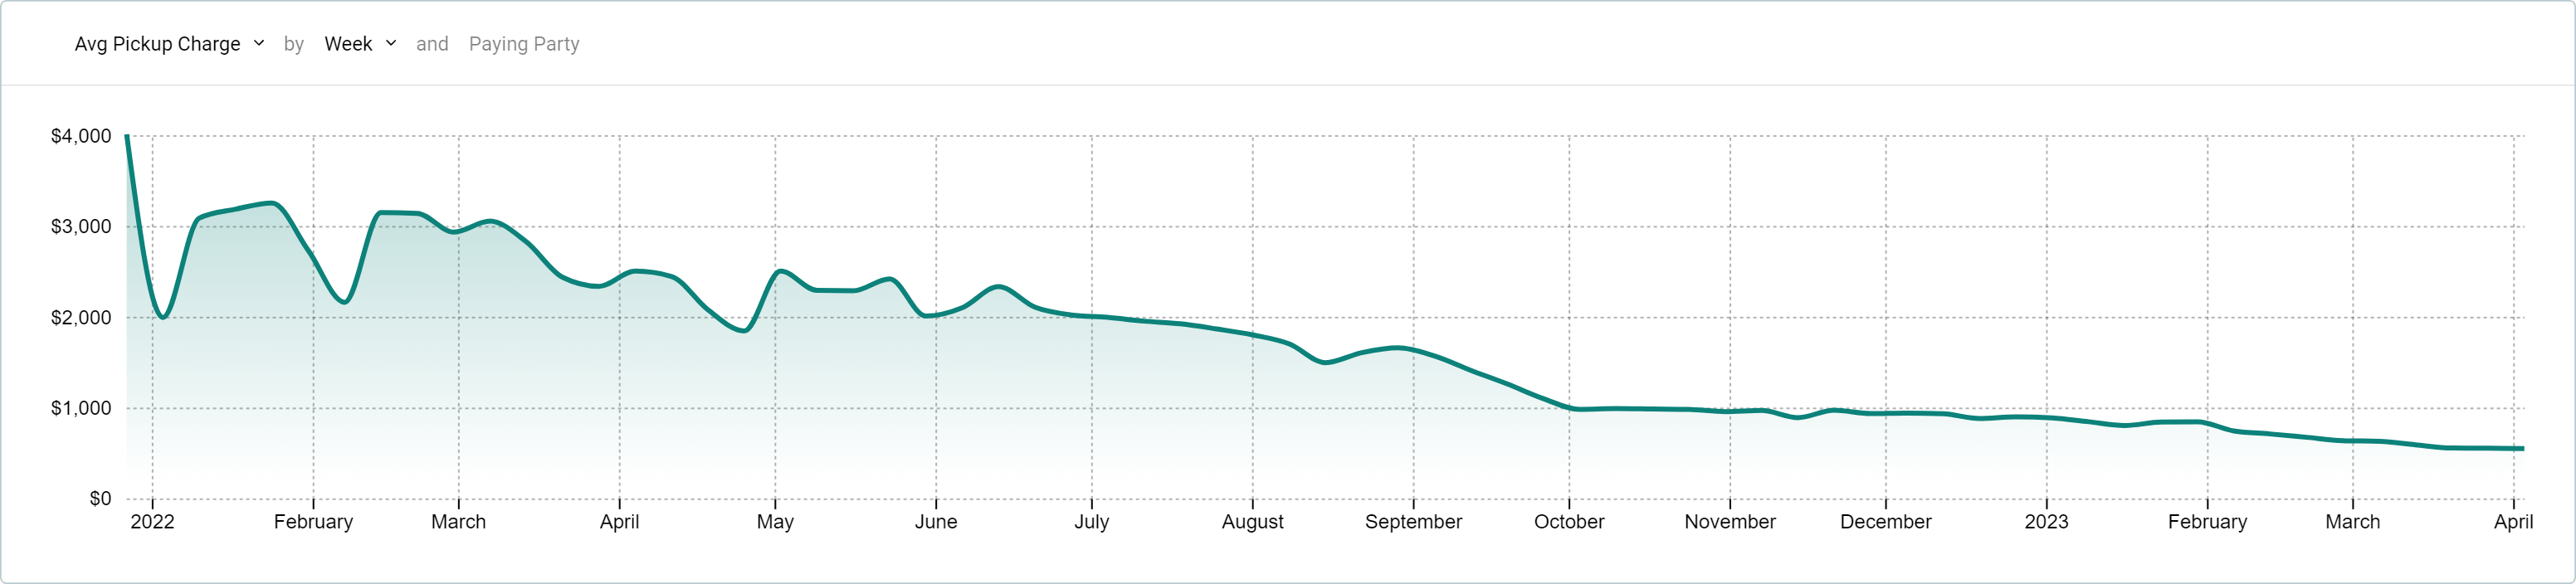
For example, the graph below depicts the pick-up charges for 40HCs (brand new) for the Shanghai to Houston stretch. As observed, the pick-up charges for these highly sought-after boxes saw turbulent fluctuations before steadily decreasing by the end of 2022 and into 2023. Evidently, at the beginning of April 2023, one can expect to pay around $180 for this stretch.
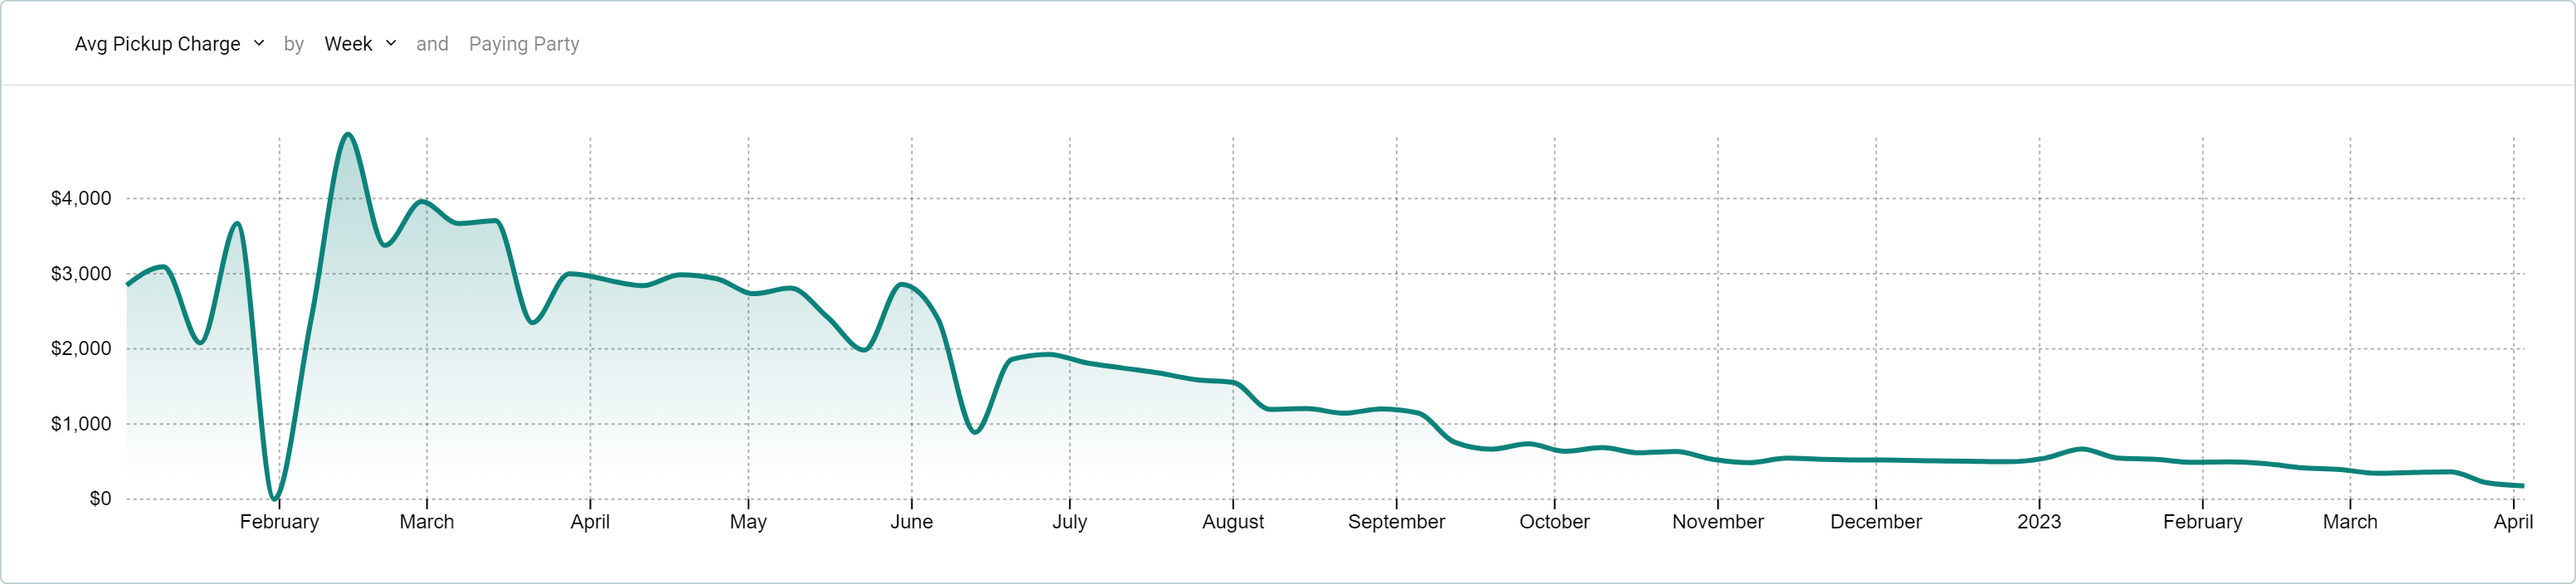 Shanghai to Houston stretch 2022-23
Furthermore, an analysis of the pick-up charges for 40HCs for all the popular China to US stretches reveals relatively the same results as the Shanghai to Houston stretch — aggressive fluctuations but an overall drop in SOC pick-up charges.
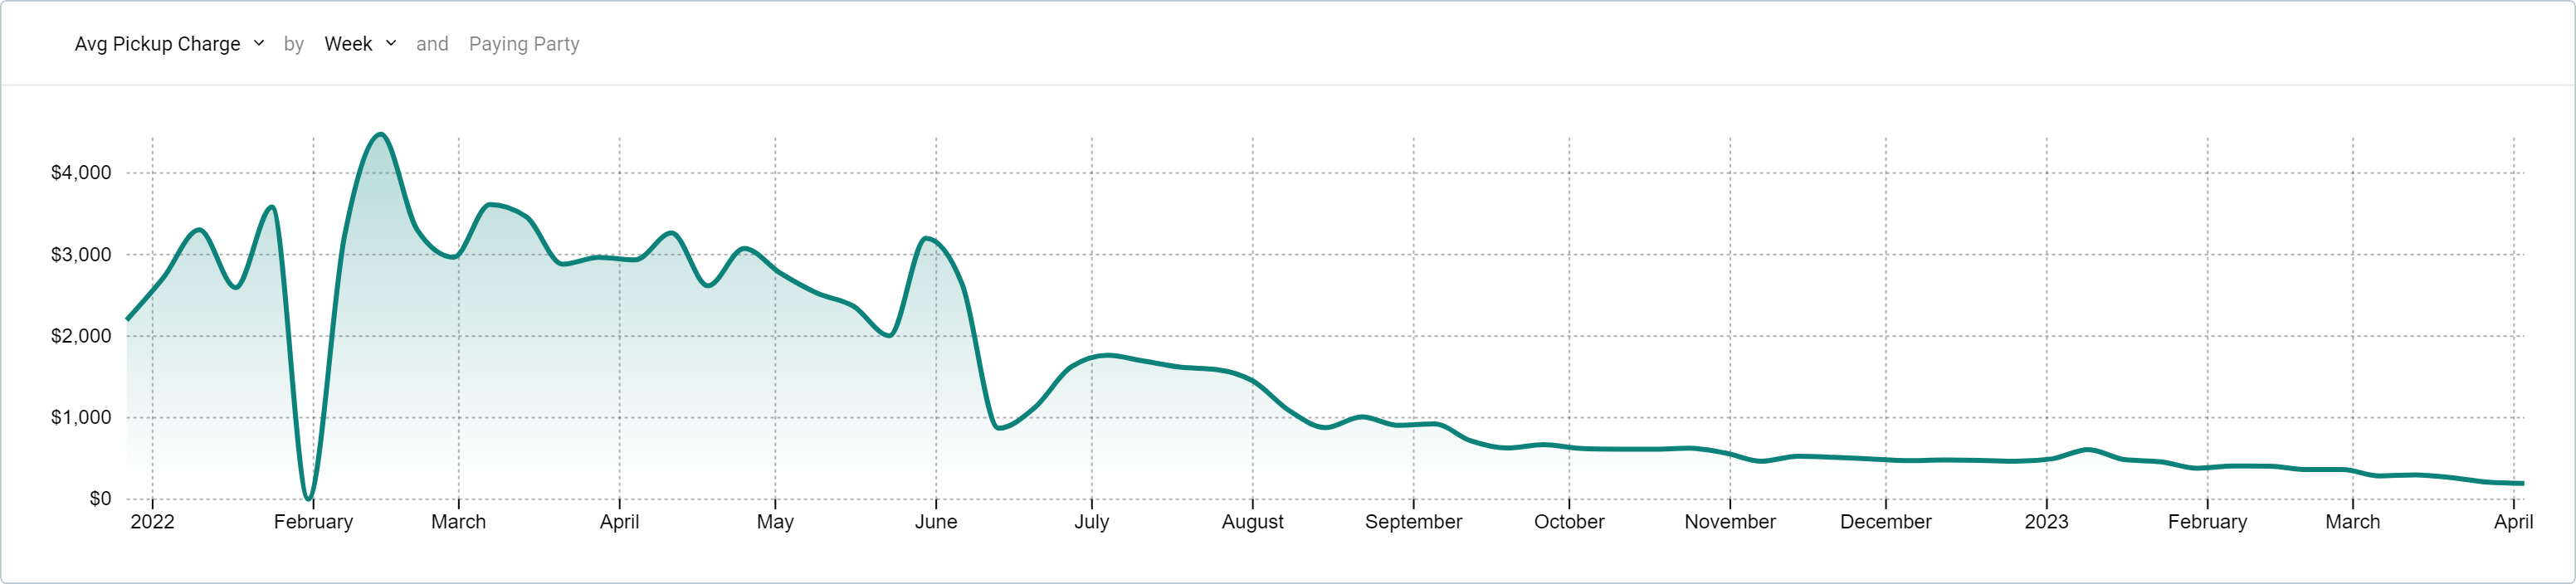 Overall China to US routes 2022-23
And if we look into European territories, we discover a similar trend. SOC pick-up charges for China to North Europe route have seen prominent spikes and falls but an overall decrease remains. A 65% decrease has been recorded between January 2022 and January 2023.
 Overall China to North Europe routes 2022-23
Various factors led to the fluctuations for the above routes, such as:
- Covid rendering its adverse effects at the beginning of 2022
- Lockdowns in major cities of China resulting in port congestion
- Worker strikes across Europe
- Ongoing Ukraine/Russian war
- Global inflation
- Anticipated global recession
Major sea freight hubs and routes
Understanding the global landscape of sea freight is crucial for efficient logistics planning. Major shipping hubs in the USA and Canada, along with key international locations around the globe play pivotal roles in the sea freight network, handling millions of containers annually.
Key shipping hubs in North America
Los Angeles/Long Beach, USA: These West Coast ports are essential gateways for trans-Pacific trade, handling a significant volume of cargo from Asia.
New York/New Jersey, USA: As a major hub on the East Coast, this port facilitates extensive trade with Europe and the Americas.
Houston, USA: Notable for its strategic location on the Gulf Coast, Houston is a vital port for Latin American trade and the global oil market. The port also has numerous options for those looking for a shipping container for sale in Houston.
Vancouver, Canada: Canada’s largest port, Vancouver, serves as a crucial link to Asian markets, handling a diverse range of cargo.
Key shipping hubs internationally
Shanghai, China: The busiest container port globally, Shanghai is a linchpin in trade between Asia, Europe, and the Americas.
Singapore: As a major transshipment hub, Singapore’s state-of-the-art facilities connect shipping routes between the East and West.
Rotterdam, Netherlands: This is Europe’s largest port, strategically positioned for access to the European hinterland and beyond.
Dubai, UAE: An important hub for trade between Asia, Europe, and Africa, leveraging its strategic geographic position.
Key shipping routes
Trans-Pacific route: This route is crucial for trade between Asia and North America, with key ports including Shanghai, Los Angeles, and Long Beach.
Asia-Europe route: Connecting Asia’s manufacturing hubs with Europe’s consumer markets, major ports along this route include Shanghai, Singapore, and Rotterdam.
Asia-Middle East route: This route facilitates trade between Asian markets and the Middle East, with significant ports in Singapore, Dubai, and Jebel Ali.
Awareness of these hubs and routes can help businesses optimize their shipping strategies, ensuring timely and cost-effective transportation of goods. By leveraging strategic locations, industry players can better navigate the complexities of global trade, making informed decisions on shipping schedules, container availability, and cost management. This strategic insight is invaluable for maximizing efficiency and competitiveness in the global market.
Conventional methods of learning market trends
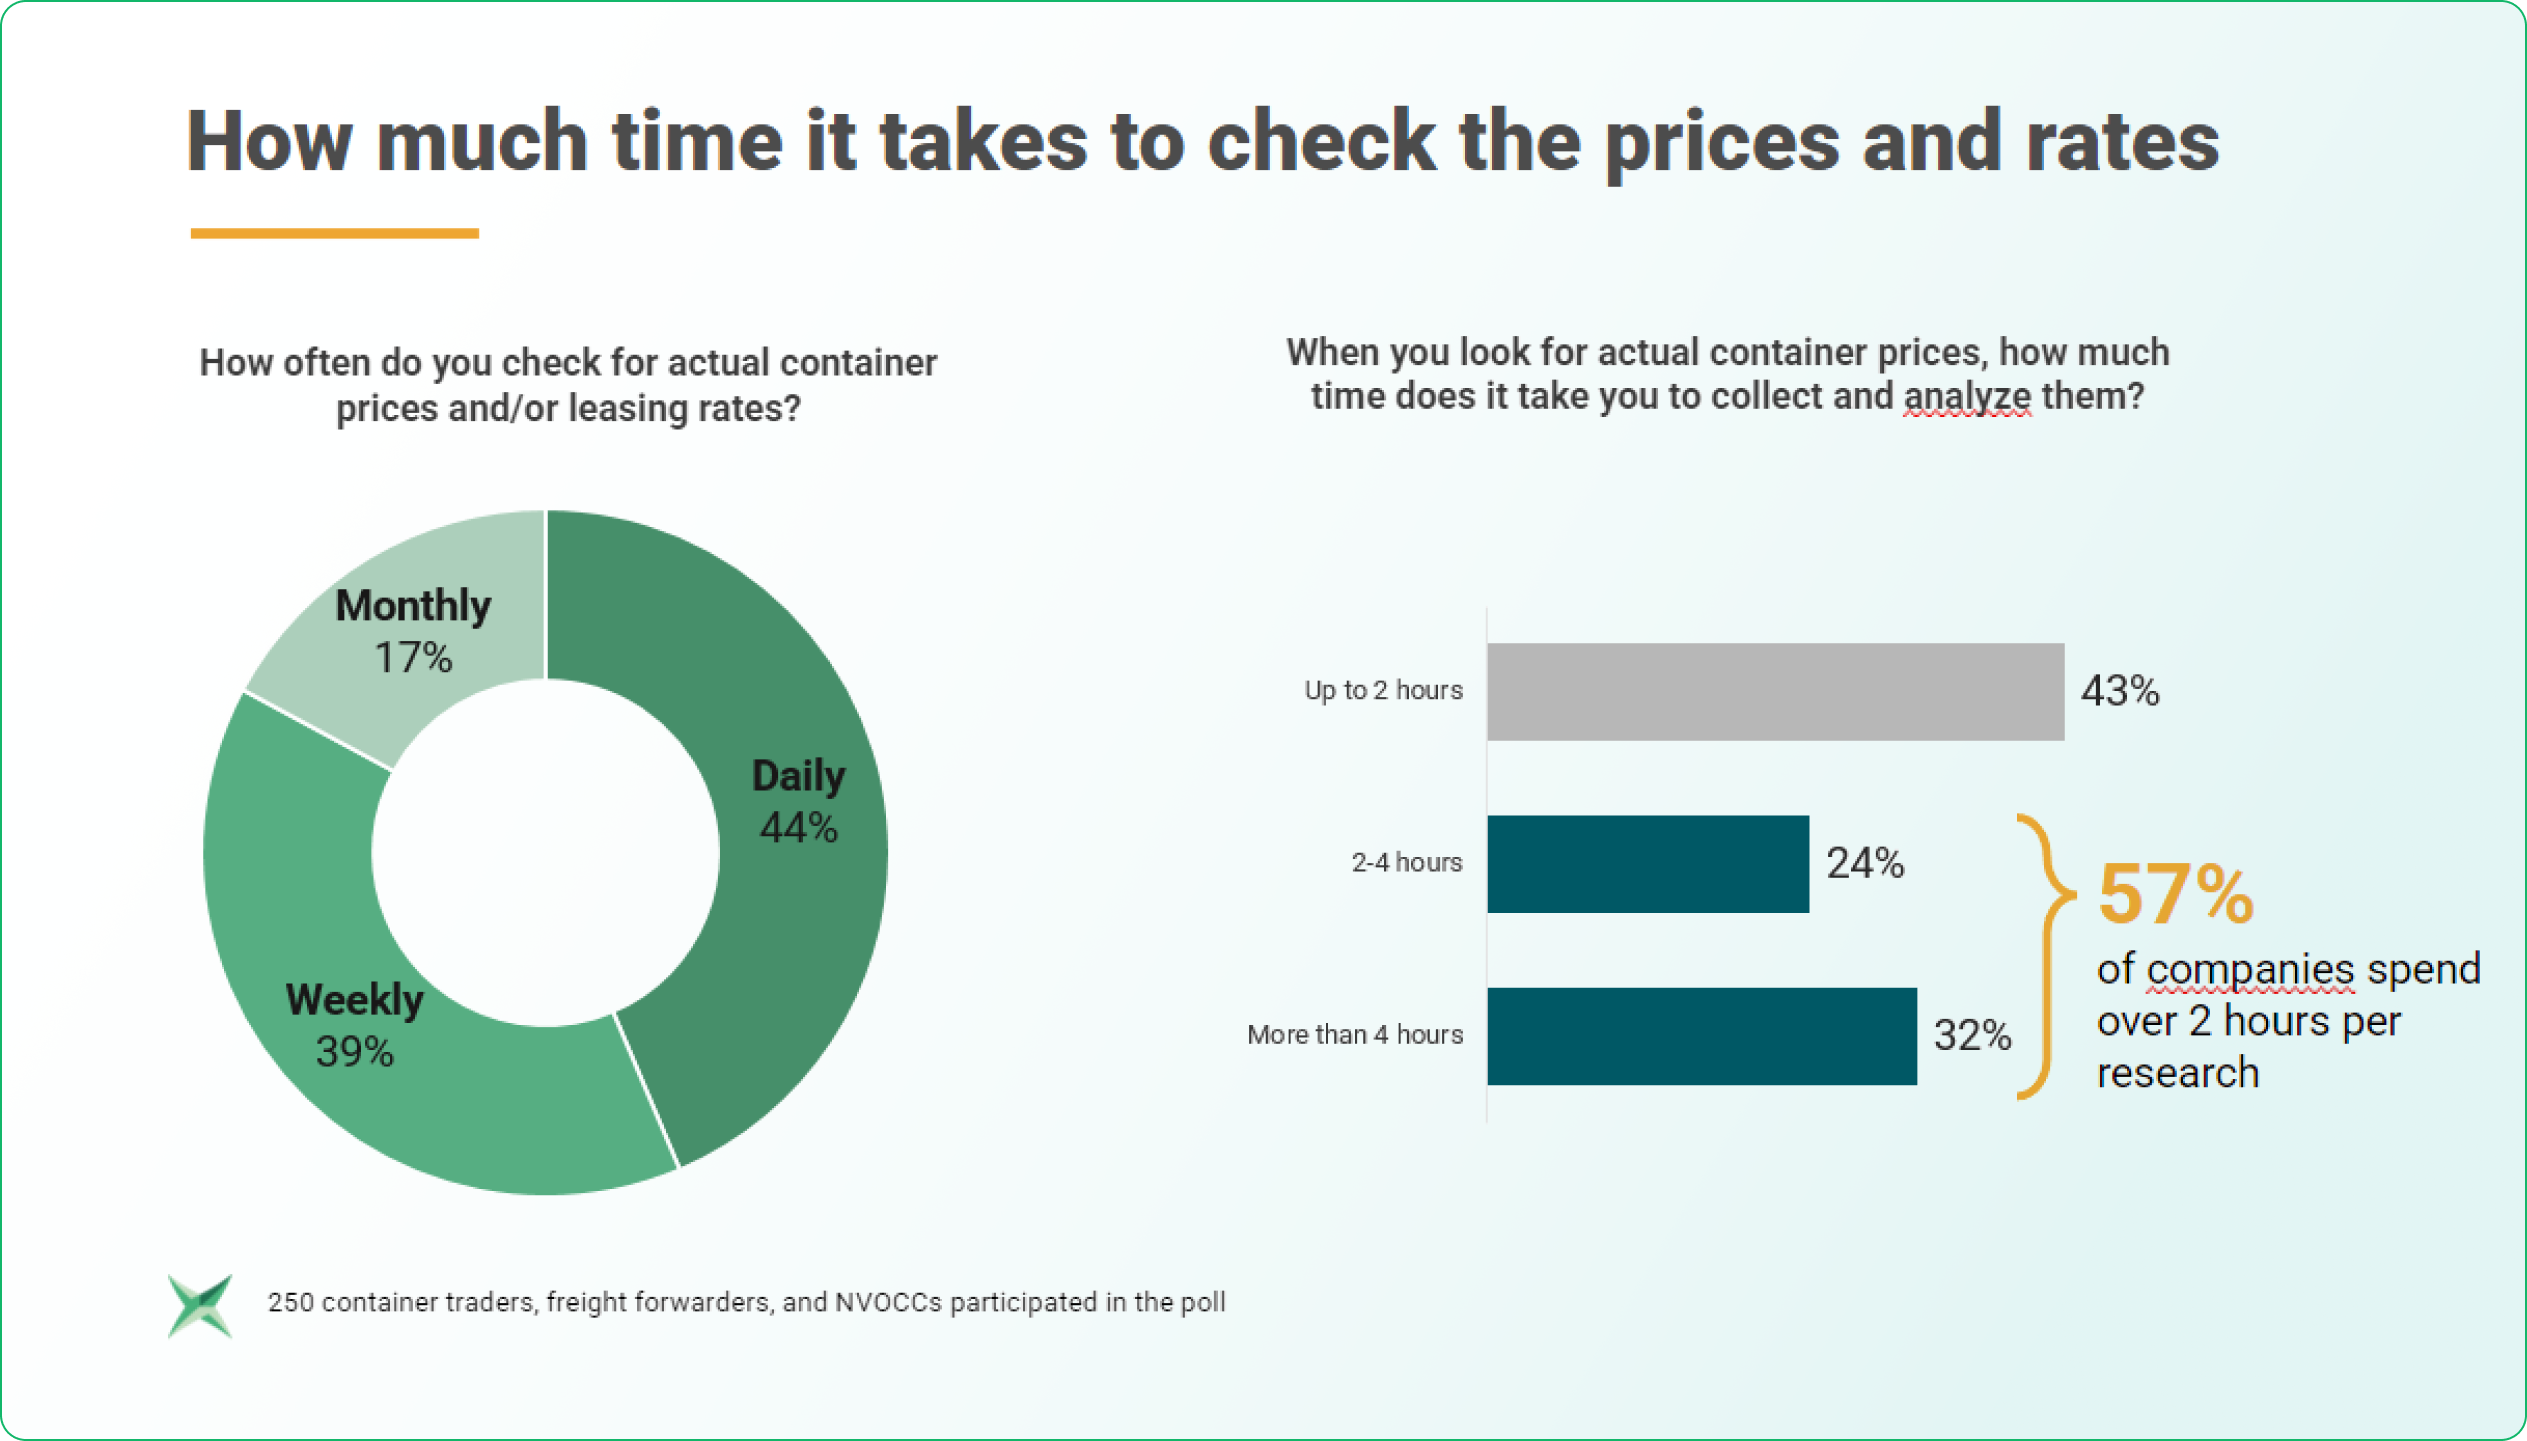
To understand how container logistics companies keep up with industry trends, Container xChange conducted a survey. In this survey, we uncovered that many companies utilize the tedious methods of phone calls, WhatsApp messaging, and email correspondence with their partners and suppliers. Getting the latest container price and SOC leasing rate trends requires one to contact several partners and suppliers. This task is extensive and immensely time-consuming.
The survey also revealed that 44% of companies research container prices and leasing rates every day. And 57% of respondents invest more than 2 hours to do so. An alarming 40 hours per month are spent on unveiling current market values.
xChange Insights: An efficient solution
To save time and make the market more transparent for its players, companies like Container xChange have developed data-driven tools. One of them being xChange Insights. Insights aggregate data from Container xChange’s container trading and leasing marketplaces, industry-leading sellers/suppliers, and shipping lines to supply daily updated price data in 130 cities. Here’s one of a few scenarios where products like xChange Insights can save up to 40 working hours:
Due to the recent spike in US container prices, several companies are looking to buy containers outside of the US at a lower cost and have them relocated to their desired location.
How can they do this using data?
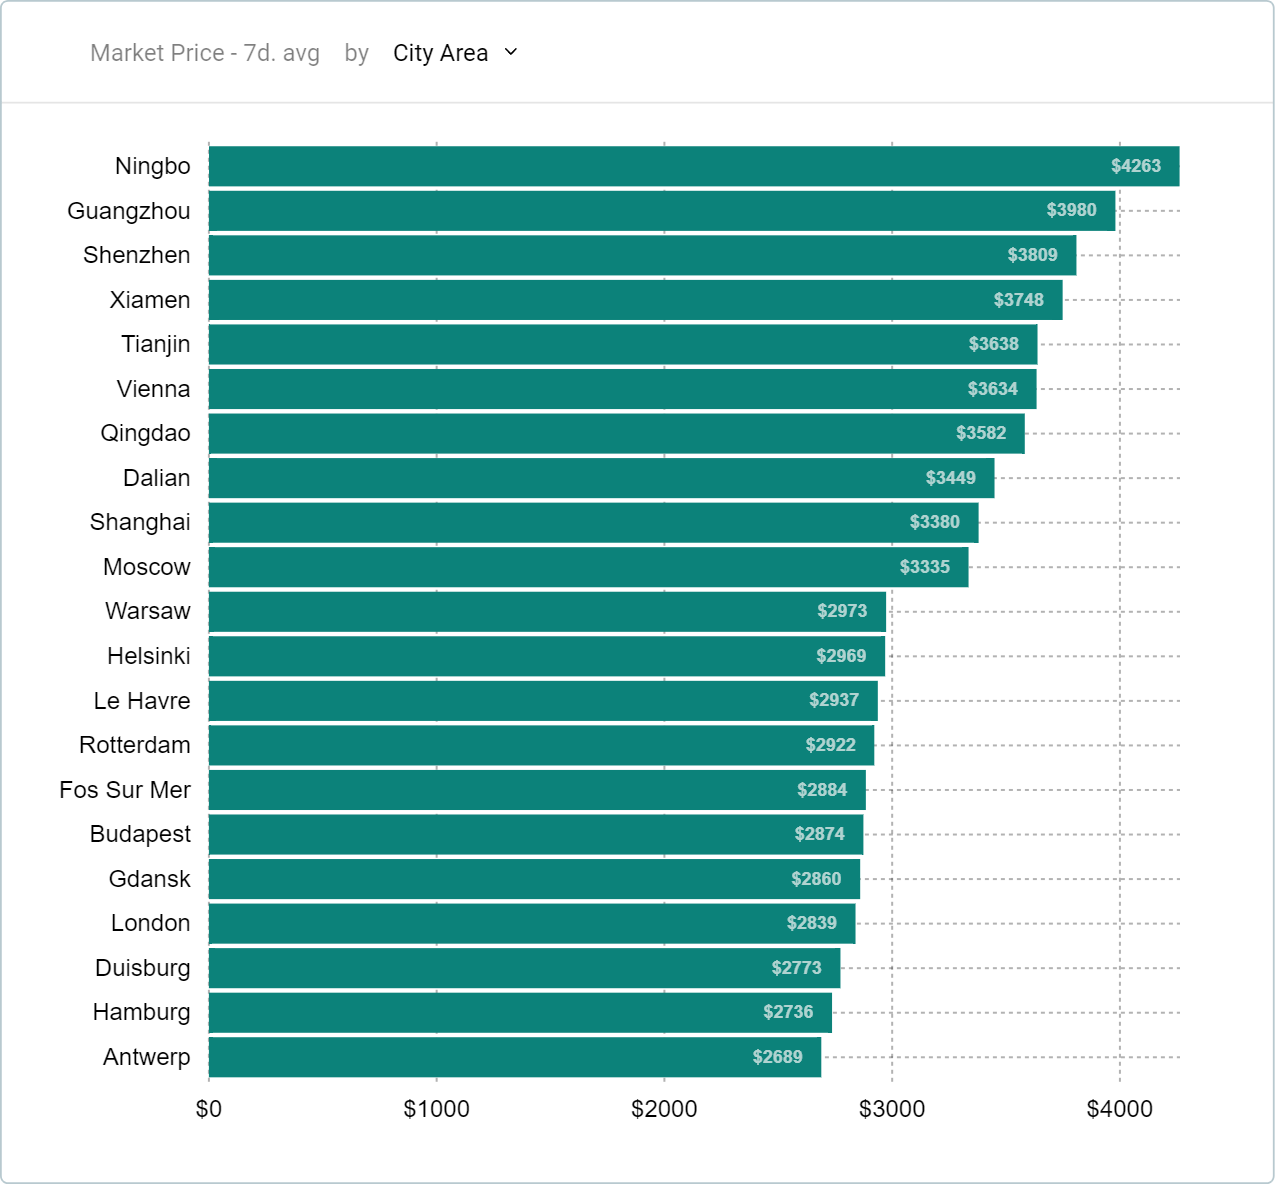
Step 1: Check global locations supplying the cheapest containers. For example, currently, container prices in Antwerp, Belgium are lower than prices in the US as well as China. In Antwerp, a 40ft HC container (brand new) will cost approximately $2,700.
Step 2: To avoid unnecessary costs when transporting containers from one country to another, companies can lease out their containers for one-way moves. Doing so, they will save money on hefty empty repositioning costs and earn money while still having their containers moved to where they need them.
Companies can leverage Insights to learn about the current container market prices and their potential earnings from one-way leasing movements. For example, the current rate to lease out new 40ft HC containers from Antwerp to Houston is roughly $540 per container. And it takes around 70 days to relocate these containers.
Step 3: Check selling prices in Houston. Currently, 40ft HC units are selling for $3,800 in Houston. To find more great offers on 40ft high cubes like this, explore shipping containers for sale Houston on Container xChange now.
Therefore, it’s easy to determine the expected profit for a single unit, here’s how:
Earnings on leasing out unit + unit sales revenue – Cost price per unit
$540 + $3,800 – $2,700
Average earnings for a unit = $1,640
In essence, American traders are known for their entrepreneurial spirit and enthusiasm to enter new markets to grow their businesses. With Container xChange, these traders can learn the current container market trends and industry news, empowering them to enter new markets with confidence.
To learn more about xChange Insights, book a free demo today by clicking on the banner below: