container market analysisshipping disruption
Strait of Hormuz Crisis: Capacity Contraction, "End of Voyage" BoL Risks, and the 2026 Equipment Market
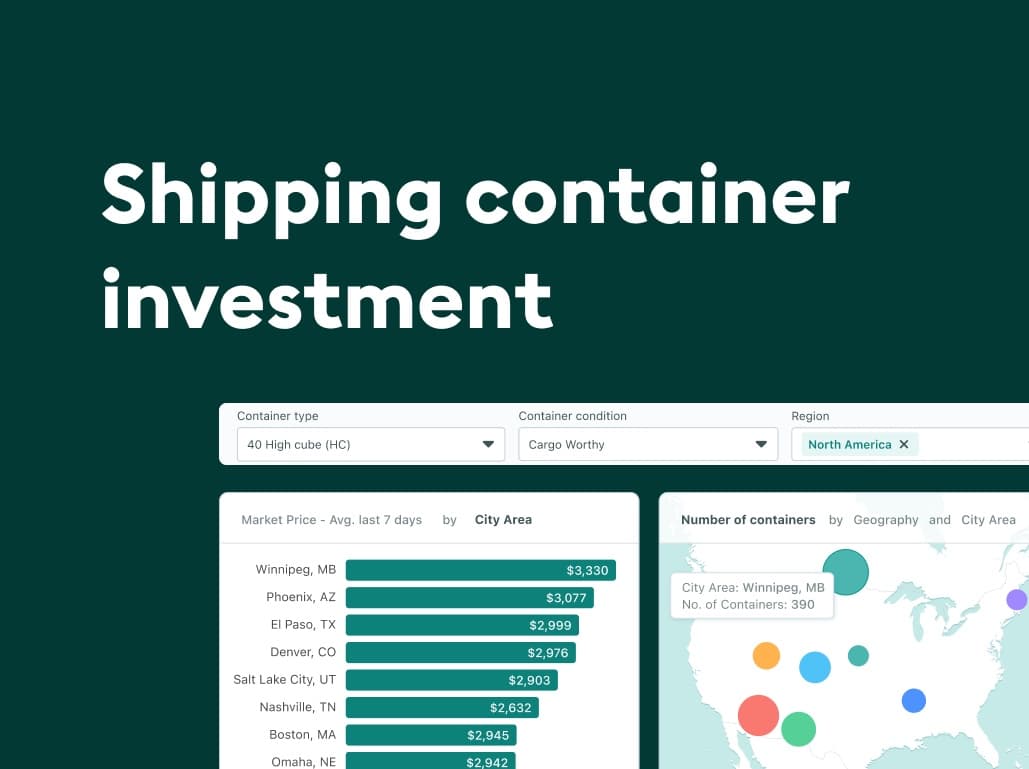
How does the Strait of Hormuz crisis affect your container supply? Expert analysis on freight rates, BoL risks, and why SOC containers are now essential.
Christian Roeloffs
![A complete guide for used 40ft shipping container [2025]](/_next/image?url=%2Fblog%2Fused-40ft-shipping-container-featured.jpg&w=1920&q=75)
![Used 20ft shipping container: Top benefits & uses [+ Prices ‘25]](/_next/image?url=%2Fblog%2Fused-20ft-shipping-container-featured.jpg&w=1920&q=75)
![How many pallets fit in a container: 20ft & 40ft [+find containers at best prices]](/_next/image?url=%2Fblog%2Fhow-many-pallets-fit-in-a-container-featured.jpg&w=1920&q=75)
![Shipping container cafe: Benefits & popular ideas [+how to find containers for cafes]](/_next/image?url=%2Fblog%2Fshipping-container-cafe-featured.jpg&w=1920&q=75)